Published Sep 15, 2022 | 2:35 PM ⚊ Updated Sep 15, 2022 | 4:25 PM


An official inauguration stone in an inundated lane of Hyderabad, 2022 (Hakku initiative)

Monsoons and yearly urban flooding test government claims made to taxpayers, businesses, professionals, investors, householders, and all voters.
Citizens face monsoon distress that remains uncharted and undergo unaddressed human suffering in cities like Bengaluru and Hyderabad.
To give a recent example, overnight on September 4–5, 131.6 mm rain was recorded in Bengaluru. This is high, even by Bengaluru standards, which in the past recorded yearly rainfall of 1,500 mm in 2021, 1,200 mm in 2020, and above 900 mm in 2019.
This year, since June, rain-related losses are ₹7,647 crore, as per Karnataka government estimates.
Similarly, heavy rainfall plays a big role in the life of citizens of Hyderabad.
For example, over 100 mm rainfall was recorded in just two hours in September 2021. In the month of October in 2020, over 19 cm of rain was recorded. The 2020 floods led to losses of over ₹8,000 crore.
Behind every one of these numbers in these cities are thousands of affected lives and livelihoods.
Quantifying distress and measuring it would help in creating a citizen-centric plan, which can help us design and implement sustainable solutions.
To this end, the Monsoon Distress Index was developed by the Hakku Initiative. The 11 distress indicators were finalised based on data gathered from ground surveys, interviews, government information, and independent research. The methodology kept the citizen at the centre of research, which began in the weeks following the 2020 Hyderabad floods and was fine-tuned in 2021 and 2022.
The 11-point distress indicators are:
(i) Road flooding; (ii) Poor waste management; (iii) Drinking water contamination; (iv) Damage to private property; (v) Damage to government property; (vi) Water-logging; (vii) Traffic congestion; (viii) Manhole overflow; (ix) Power cuts; (x) Nala overflow; (xi) Accidents due to potholes and open manholes.
The Monsoon Distress Index seeks to place the citizen at the centre of disaster management and planning of cities.

Property tax collections in the various zones of Hyderabad (left) and the high Monsoon Distress Index (MDI) in Charminar Zone (Hakku Initiative)
The findings quantify the levels of monsoon distress in the six municipal zones of Hyderabad.
It is often observable that poorer parts of a city face higher monsoon distress than the more wealthy parts. This is corroborated by the Monsoon Distress Index findings and their correlation with property tax collections.
Among the six zones of Hyderabad, Charminar zone has the lowest property tax collections and Khairtabad the highest.
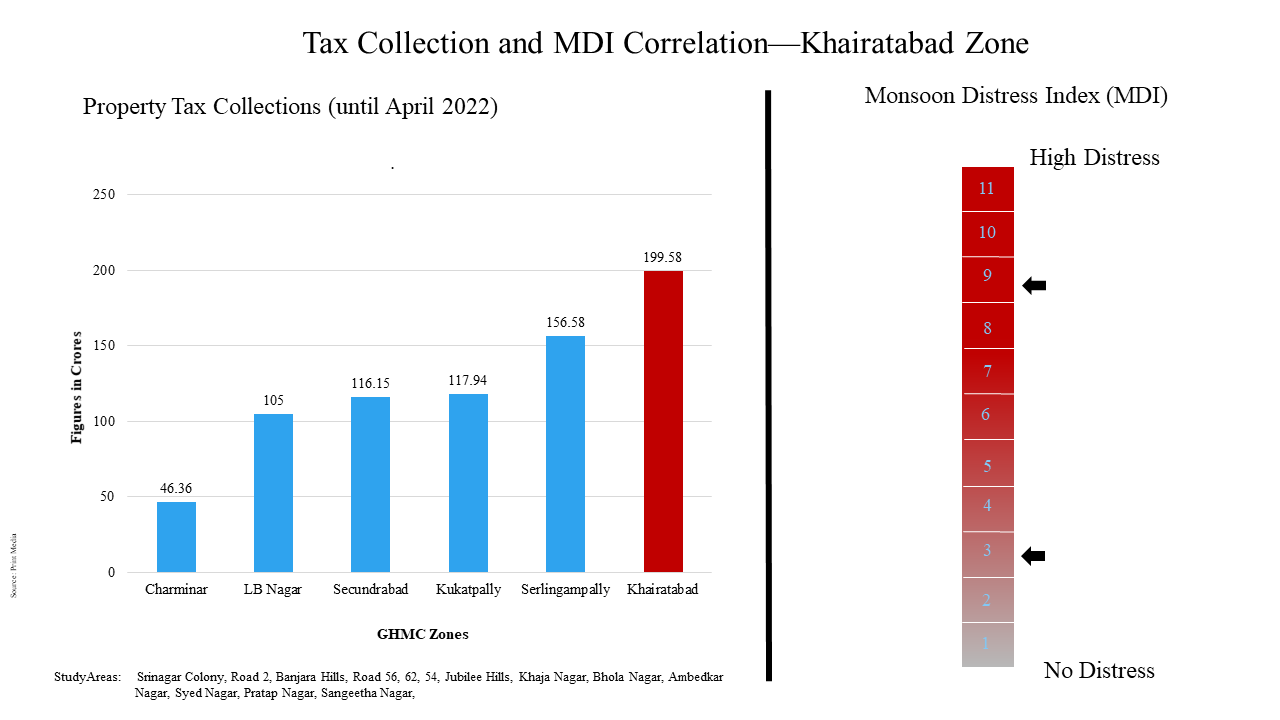
Property tax collections in the various zones of Hyderabad (left) and a relatively milder monsoon distress in Khairtabad Zone (Hakku Initiative)
The minimum distress in the Charminar zone is at 5, which is almost halfway up the scale. The minimum distress in the Khairtabad zone is much lower at 3. Similarly, the maximum distress in the Charminar zone is at 11, which is the highest on the scale. The maximum distress in the Khairtabad zone does not cross 9.
There is a direct correlation between tax revenue and attention to infrastructure in Hyderabad, with poorer parts of the city ill-administered and ill-maintained.
As per a 2016 report by the Centre for Science and Environment (CSE), Hyderabad city had lost an estimated 3,245 hectares of wetlands in 12 years.
As the NDMA explains, such urbanisation leads to “developed catchments” because of which urban flooding can happen “in a matter of minutes” as it increases manifold the risks and the pace of flooding.
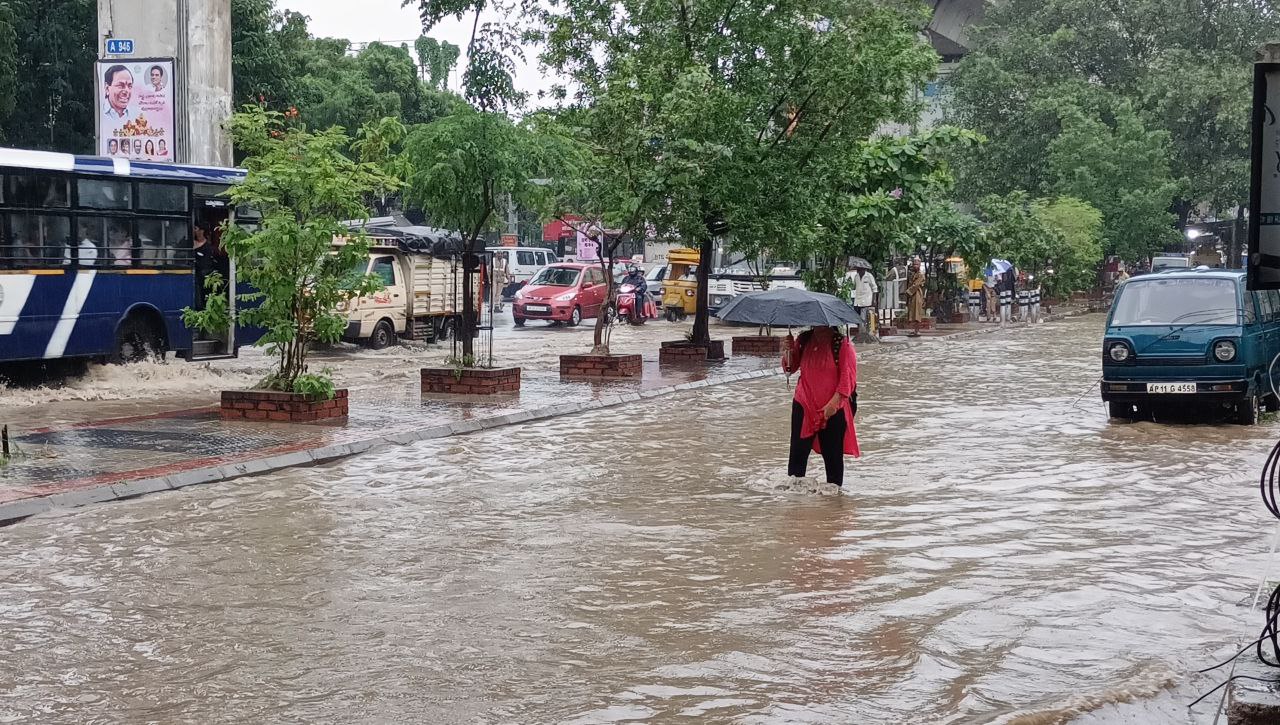
Citizens live with flooded streets after rains in Hyderabad, 2022 (Hakku initiative)
The NDMA also mentions how big cities have faced loss of life, property, and livelihoods along with severe health risks and human suffering. It lists almost every major city and every part of the nation as vulnerable to planning deficiencies and unequal to face the urban challenges.
Urban floods are a point of convergence of several issues that plague our cities.
Following are some reasons: (i) Over-population puts pressure on city infrastructure and extends it beyond efficient limits; (ii) Demand for land leads to encroachment of natural waterways and lakes; (iii) Planning irregularities and deficiencies help in regularising deviations from approved plans; (iv) Drainage networks are clogged with garbage, sewage and construction; (v) Concretisation reduces absorption by soil, and forces more volume of rain into drains, leading to overflowing, and flooding.
Every individual and his/her distress experience must inform disaster management and city planning. The Monsoon Distress Index makes it possible to maintain a year-round interactive and localised exchange of data on distress indicators between citizens and the administration.
Its components are: (1) Issues can reach up from the ground to policymaking; (2) Citizen awareness programmes can be sustained, especially on waste management and drain maintenance; (3) Encroachment of lakes and drainage pathways can have steady intervention, facilitated by this plan.
Mapping and measuring of monsoon distress will help in grading zones of a city municipality. For example in the case of Hyderabad, the Monsoon Distress Index can be used to provide information to citizens, whether residents, visitors or investors, on what to expect in that zone during rains.
Based on this, a competitive ranking of zones can take place, and the rank can improve with the improvement in the indicators.
This will also expose lopsided development, and help in resource redistribution.
The Monsoon Distress Index measurements will also assist voters to assess their elected representatives, and make citizens more responsible towards their own surroundings and the choices they make.
(Kota Neelima is an author and political scientist, and heads the Institute of Perception Studies in New Delhi and Hakku Initiative in Hyderabad. She writes on social journalism, rural-urban distress, and citizen visibility. She tweets @KotaNeelima. These are the personal views of the author)
